Infographic Design
Our expert infographic design services turn difficult information into visually appealing, captivating, and understandable visuals.
Our team creates infographics that successfully and clearly convey your idea by fusing data visualisation methodologies, graphic design principles, and innovative tactics.
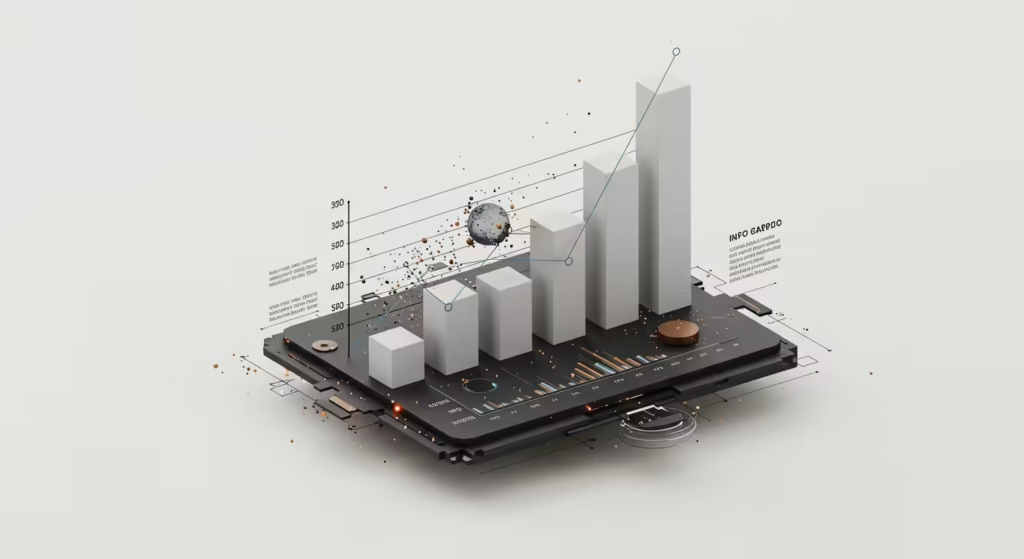
Our infographic design services offer a comprehensive approach, combining visual storytelling and technical design expertise to help you communicate complex ideas and data in a simple, compelling way.

Effective Communication of Complex Data
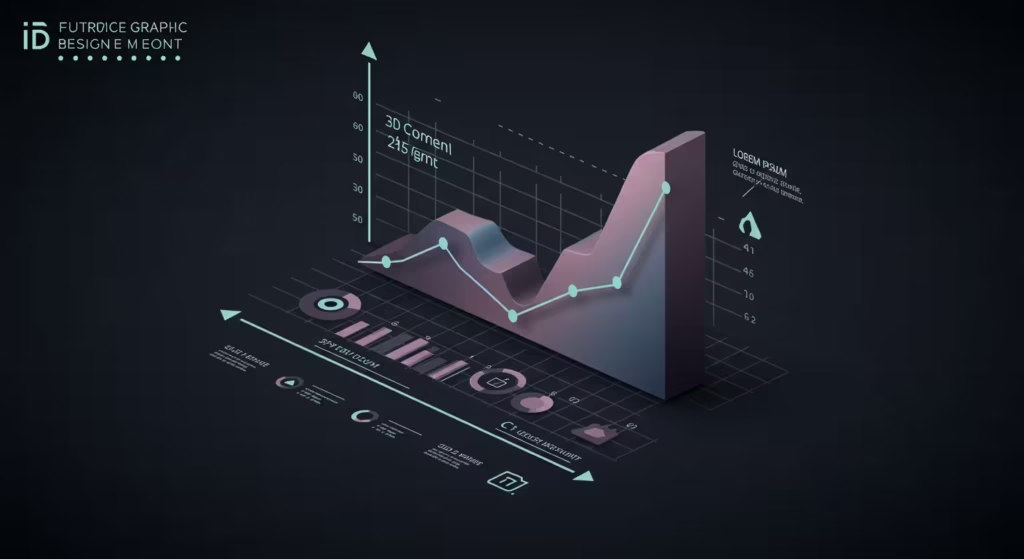
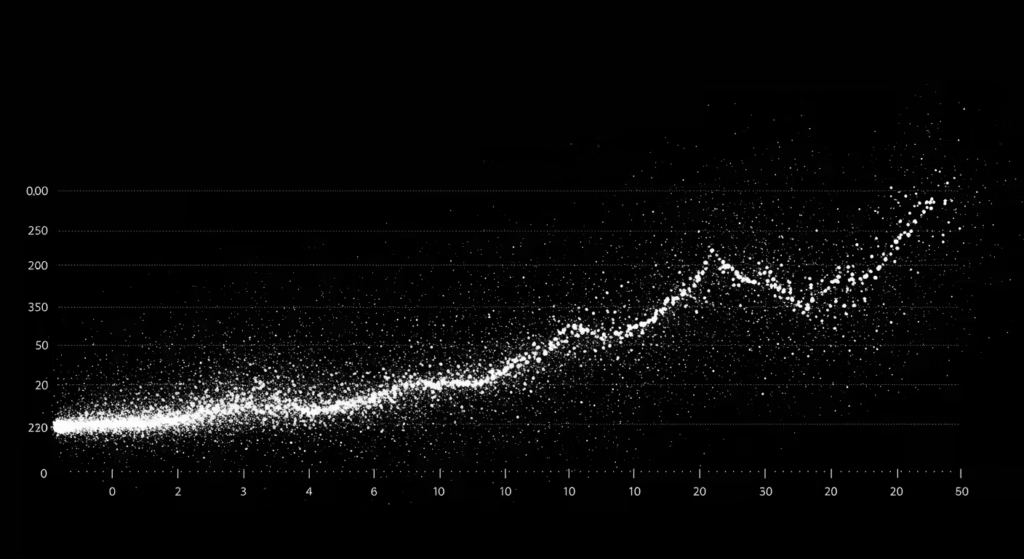
Infographics are an effective tool for demythologising complex ideas. We may simplify complex material into easily understood chunks by utilising data visualisation techniques like statistical graphics, vector graphics, and chart design. No matter how complicated the data is, our design approach makes use of visual components like proportion, size, and symmetry to guarantee that your audience can quickly understand the main points.
Enhanced User Engagement Through Visual Storytelling
We produce visual storytelling and interactive visuals that captivate your audience. Our infographics bring the facts to life using colour psychology, dynamic iconography, and simple style. We direct your audience’s attention to the most crucial details by highlighting key points and visual flow, which encourages them to stay on the page longer.
Affordable and Effective Marketing Tool
Your infographics must display beautifully on all screens. No matter the screen size, your infographics will remain impactful and clear thanks to our flexible design strategy.
We ensure that your infographics are pixel-perfect and usable by everyone, from wireframing and layout design to user-centred design and accessibility design.
Our Infographic Services
Visual Hierarchy
To direct the viewer’s attention and make sure the most crucial information is shown, we employ visual hierarchy. Strategic element placement produces a smooth flow that improves understanding.
Dominance and Emphasis
Dominance and emphasis are used in our designs to draw attention to the most important facts, which helps to make important statements memorable and powerful.
Balance and Symmetry
In order to produce visually appealing layouts and make sure the infographic seems organised, we use symmetry and balance.
Contrast
By employing contrast, we make sure that every design element is easily readable and highlights the infographic’s most crucial sections.
Unity and Harmony
We make sure that every component of the design functions as a whole, giving the audience a cohesive and pleasing visual experience.
Proportion and Scale
To ensure that the data is presented in an effective visual manner, we employ size and proportion to provide a feeling of hierarchy within the infographic.
Alignment and Spacing
In order to produce neat, well-structured infographics that are simple to read and comprehend, our design method makes use of alignment and suitable space.
Gestalt Principles
Gestalt concepts, such figure/ground connections, are applied to assist your audience understand the information offered in a natural way.
Colour Theory
We employ colour harmonies to elicit the appropriate emotional reaction and strengthen your brand identification, whether it is through monochromatic palettes or complimentary hues.
Typography
We use skilled typography to make sure your typefaces are readable and complement each other, bolstering the voice of your brand and improving readability.
Data Representation
Our expertise lies in statistical graphics and data storytelling, converting unprocessed data into imaginative visual representations and significant visual metaphors.
Mobile-Optimised Design
We produce responsive, mobile-first, interactive infographics that make your designs accessible and interesting across all platforms.
Prices
Basic Infographic Design Package
Includes a detailed and custom designed infographic with up to 5 data points and two rounds of revisions.
Completion Time
3 Business Days
£100
Advanced Infographic Design Package
Includes a fully customised infographic with up to 10 data points, two rounds of revisions, and multiple format options.
Completion Time
5 Business Days
£180
Related Services
Infographic Design FAQ's
Some of the most common queries we receive about infographic design
What is the purpose of an infographic in digital marketing?
Infographics are a powerful tool for marketing since they facilitate the rapid and visual communication of information. Infographics may increase audience engagement and simplify difficult concepts for businesses in Inverness.
How do infographics benefit SEO?
Infographics promote backlinks and sharing, which improves the SEO of your website. Infographics and other high-quality material boost Inverness businesses’ search engine rankings and traffic.
Can you design infographics that match my brand style?
Of course. In order to maintain consistency across all of your marketing products, we make sure that every infographic adheres to the colours, typefaces, and design of your brand.
How many revisions are included in the infographic design service?
One or two revision cycles are included in every bundle. To make sure the finished infographic lives up to expectations, we collaborate closely with Inverness businesses.
Do you offer social media-optimised infographics?
Indeed, we create infographics specifically for social media sites, making sure that their dimensions and layout optimise interaction on sites like Facebook and LinkedIn.
